Despite low market mood, HK stocks present buy opportunities


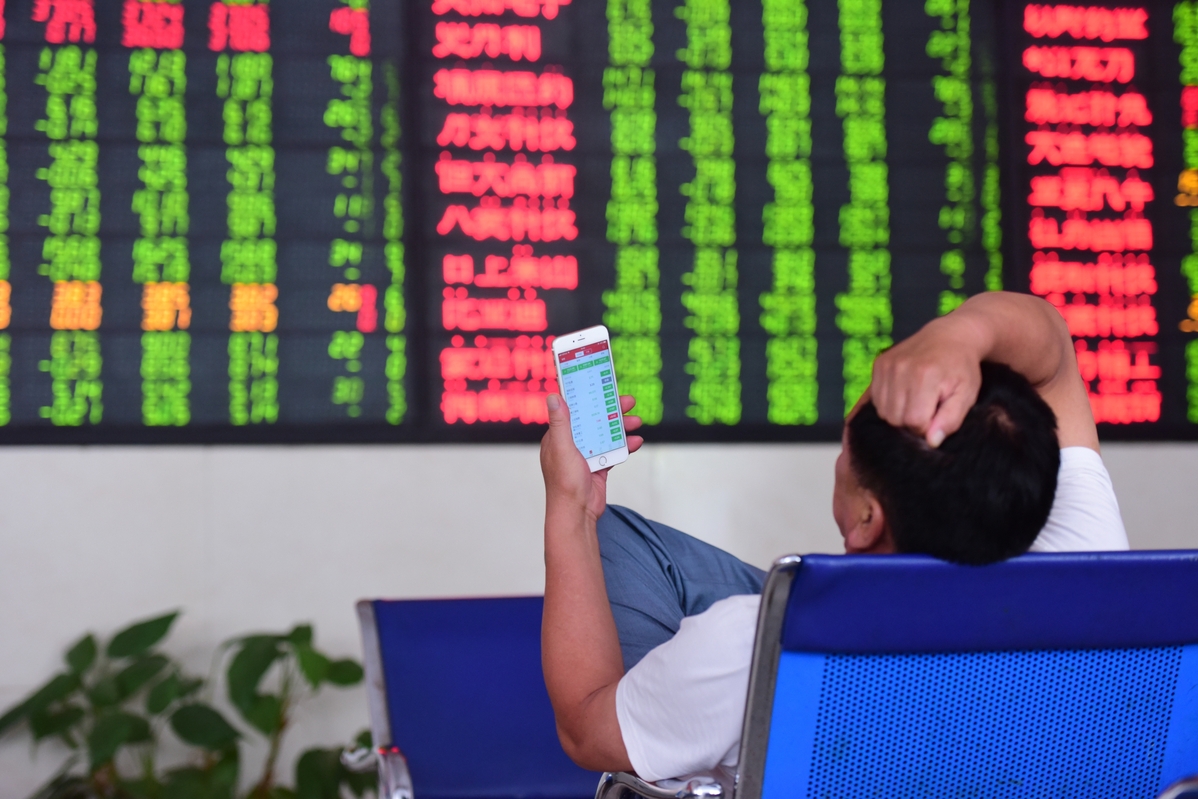
A sense of uncertainty arising from recent developments has gripped investors in the Hong Kong stock market. But, others see this as a marvelous buying opportunity.
Depending on which gauge you use to value the market, valuations are either at the lowest level in many years or at least close to the lowest level of the past few decades.
The value of the Hong Kong market is even more attractive when compared to the US stock market. Currently, the US stock market valuation is much higher than that of Hong Kong's.
The weak economic outlook for the next decade, caused by the escalating China-US trade dispute, is piling pressure on the already fragile valuations. Investors who have already made a fortune by holding US stocks in the past decade, should now look for some alternative investments.
"Whatever does not kill you makes you stronger" - so goes a maxim. Whatever does not kill the market, it can be argued, will also bring wonderful value for those who dare to buy at the gloomiest moments.
Investors should remember that gloomy news brings marvelous prices; and marvelous prices generate wonderful returns.
Hong Kong is offering one such opportunity to global investors now. Veteran investors are unlikely to miss it.
While comparing the current valuations of the Hong Kong stock market to its key historic levels, analysts of the Hang Seng China Enterprise Index or HSCEI, one of the leading indices in Hong Kong, usually make a mistake. This common mistake usually forbids analysts from seeing the real extent of the valuation.
Currently the P/B or price-to-book ratio - it is a gauge of an entity's market valuation relative to its book value - of HSCEI is 0.91, higher than its historical low point of the past many years, which is 0.77 of Feb 12, 2016. However, this straight comparison is misleading. (Data used in this article is obtained from the Wind Financial Terminal and is calculated using the closing prices of Aug 28.)
As the HSCEI adjusted its member list on March 5, 2018, the valuation system of this index was strongly adjusted. This adjustment added 11 new members to the index. Some of them have extremely high valuations. For instance, Tencent was trading at 14.7 P/B ratio and Zhong An Online was trading at 12.9 P/B ratio on that particular day. This adjustment of index constituents abruptly increased the P/B ratio of the HSCEI by 0.23.
Taking this technical factor into consideration, if we use the old gauge, the current P/B ratio of the HSCEI should no longer be 0.91. It should be 0.68 instead, 12 percent lower than the previous low point of 0.77. Don't forget that what followed this 0.77 spot at the beginning of 2016: the HSCEI rose from 7,500 to almost 14,000 within just two years.
Investors might ask this question: why don't we compare the valuation to 2008? Isn't the end of 2008, when the global financial crisis was growling, supposed to have the lowest historical valuation? Fact is, the valuation of the Hong Kong market in 2008 was even higher than the valley that appeared in February 2016. The P/B ratio of the HSCEI on Oct 27, 2008, which was the lowest in 2008, was as high as 1.05, much higher than the levels that were discussed above.
Assessment of other indices will tell investors roughly the same story. Currently, the Hang Seng Index or HSI, the leading benchmark index of Hong Kong, trades at 0.99 P/B ratio. Its lowest points in 2008 and 2016 were 1.09 and 0.88 respectively. This shows roughly the same picture as what can be told by the valuation comparison of the HSCEI.
Don't forget how much the HSI rallied after these points in time. The HSI rose from 10,676 in 2008 to around 23,000 in just a year. It again rose from the trough of around 18,500 in 2016 to as high as 33,484 within just two years. Great prices and valuations always bring great investment results.
Let me explain why I am using the P/B ratio rather than the more common P/E or price-to-earnings ratio as the gauge to calculate the valuation history of indices. Although P/E ratio is more frequently cited in financial analysis, the volatility of earning, as it fluctuates from the top of the business cycle to the bottom, makes it unfit for a comparison that is made across many years.
On the contrary, the book values of companies usually remain more solid and therefore the P/B ratio is better suited for this kind of long-term comparison.
There are at least three principles that investors should follow when they pick stocks.
First, investors should avoid stocks that have weak fundamentals. As an open market, the Hong Kong stock market contains many kinds of companies. Some of them are notorious for their poor fundamentals and ordinary long-term performance. One extreme case is that of a company that dropped from an adjusted price of around HK$20,000 ($2,550) in the late 1980s to HK$0.1 in 2019.
Second, investors should not bottom-fish stocks that have neither large deduction of prices nor low valuations. Although the whole market is experiencing a low mood now, not every stock enjoys a low valuation and a cheap price. Some of them, although having mediocre fundamentals, are still trading at high valuations.
Third, investors should pay more attention to the companies that mainly operate in the mainland. While today the per-capita GDP of Hong Kong is as high as that of the first-tier economies around the world, the Chinese mainland is still having huge economic potential as its per-capita GDP is only around 20 percent of the world's matured economies.
Therefore, companies that hold dominant positions in the mainland market have much larger potential compared to their contemporaries.
The writer is the chief strategist at Cinda Securities.


