Economic collapse due to weak performance
Updated: 2011-08-08 11:46
(China Daily)
|
|||||||||||
Effect may be much larger than first worldwide financial crisis in 2008

When markets concentrate on detail they can lose sight of the larger picture. The lifting of the United States debt ceiling is a detail and it obscures several ongoing problems.
These include limits on the ability of the US to create stimulus packages to help a struggling economy; persistently low growth figures and stubbornly high unemployment figures; a failure to address the long-term structural issues that plague an anemic growth model addicted to every increasing debt; the damage done to the status and confidence in the US as a stable and reliable economic state and suitable custodian of a reserve currency and, finally, the threat of downgrades to debt status which have some regulatory effects on the way investment allocation is benchmarked and assessed. Once discussed, the threat, the possibility of a downgrade cannot be erased. It is not possible to return to the prior situation. The reputational damage has been done and cannot be undone.
Who cares about a loss of triple-A rating? Some US politicians argue it is not important because investors "know" the US will never default and investors also have no options other than US debt, be it triple-A or less. This view reflects an undesirable level of arrogance and fiscal irresponsibility.
Some analysts argue that a single downgrade by Standard & Poor's ratings agency can be safely ignored. These arguments undermine the supposed independent objectivity of the ratings agencies and the role they play in investment decision-making. Stripped of partisanship by US ratings agencies, the decision by the Chinese rating agency Dagong to downgrade US debt looks more objective as long-term structural problems remain in the US economy.
If the debt deal is so good, then why has the Dow dropped consistently since its announcement? These concerns help explain the brief nature of the relief rally in the Dow when the debt deals were announced and later ratified by Congress and the Senate. The chart of index activity allows us to step aside and see the broader picture. The activity of the index has been confused recently by this excessive attention to detail but now this activity is stabilizing into a more complete picture with a long-term chart pattern.
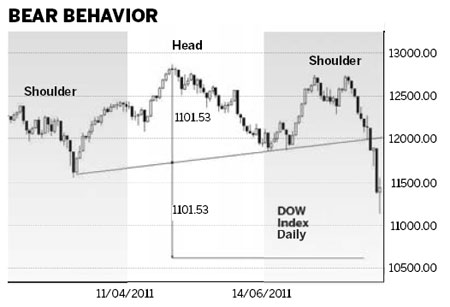
Chart patterns are very easy to identify retrospectively. They can be a little more tricky to identify in real time as they develop. The head-and-shoulders pattern in the Dow appeared to be invalidated when the market rose above 12600. This was detail analysis. Take a step back and look at a larger picture and this head-and-shoulders pattern remains in place and has developed over a longer time period.
The left shoulder developed in April. The head was created in May. The right shoulder was created by two price rallies in June and July to near 12750. This is unusual behavior for a head-and-shoulders pattern.
The pattern is proved when the index dropped below the value of the neckline near 12050. The neckline connects the two low points of the head-and-shoulders pattern. The Dow dropped below the neckline trend line on Aug 2.
The head-and-shoulders pattern is bearish. The full development of this pattern has a downside target near 10700.
Does this mean we are heading for a repeat of the global financial crisis? The chart pattern is relatively shallow. The pattern follows a prolonged sideways movement so any decline is most likely to be a rapid adjustment to a slowing economy. This includes days of high volatility. These are 2 percent and 4 percent falls in the index. This will be made worse with the activity of high frequency traders. The collapse in 2008 was from an overheating economy. This collapse is from a weak economy so the effect may be much larger.
Investors also watch related markets for leading indications of the longer term Dow index development. A continued rise in the gold price suggests downside pressure on the Dow. A continued fall in the US Dollar Index also suggests further weakness in the US economy and the Dow.
The author is a well-known international financial technical analysis expert.