Daryl Guppy
No change in upward trend for oil prices
By Daryl Guppy (China Daily)
Updated: 2011-05-30 10:53
 |
Large Medium Small |
Technical analysis of five factors on weekly NYMEX shows correction 
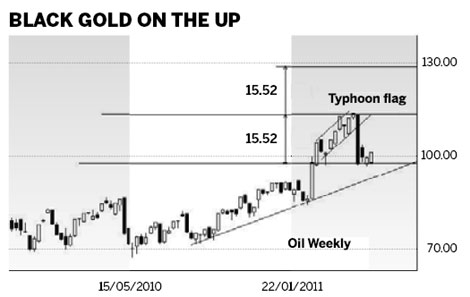
The oil price is the foundation for inflation in expanding economies. The collapse of the typhoon flag pattern on the weekly oil chart is not a signal of a change in the trend for oil prices. The fall from near $114 to below $100 is a correction in the oil price, but it is not a change in the trend. This behavior sets a higher price target for oil as the upward trend continues.
These conclusions come from the technical analysis of five different factors on the weekly NYMEX oil chart. The first analysis feature is the typhoon flag pattern that developed after the fast rise in the oil price from $86 to $105.
The typhoon flag is an upward sloping flag pattern. The pattern is defined by two parallel upward sloping trend lines. When the lower trend line value is above the height of the flagpole near $105 then the typhoon pattern is confirmed.
The typhoon flag pattern is a trend continuation pattern. It is not used to calculate any upside targets. This typhoon pattern often ends with a sudden price retreat and Bin Laden's death was enough to create these conditions. The sell signal for this pattern was the move below the lower edge of the flag trend line near $109. This signaled a rapid fall in oil prices, but this does not mean prices develop a new downward trend.
| ||||


The third analysis feature is the oil price retreat below the psychologically important level of $100. The oil price retreated to the technical support level near $98. This support level has been successfully tested several times in the past month. The $100 level is important psychologically but the pattern of support and resistance trading bands below $100 confirms $98 as the more significant technical support level.
The fourth analysis feature is the continued strength of the long-term upward trend in oil. The rally in the oil price started with the attack on Libya, but the upward trend started many months earlier. The recent price retreat is the collapse of a bubble, but it has not yet signaled a change in the trend. The upward trend in oil started in September 2010. The location of the upward trend line was confirmed with the retreat and rebound of price in February 2011. This upward trend line has a current value near $94. This means oil could fall to $94 and still remain consistent with the long-term upward trend.
The fifth analysis feature is the trading band behavior of the oil price. Oil trades between consistent support and resistance bands. The retreat from new resistance near $114 to support near $98 has created a new trading band. This is $16 wide and considerably larger than the trading band behavior when oil is below $100.
When oil is trading below $100 the pattern of support and resistance bands are around $10 wide. When oil moves above $100 the behavior of the market changes with an increase in volatility. The price moves up and down more rapidly than when oil is below $100.
The first upside target for a rebound from $98 is at $114. A breakout above $114 has a technical upside target near $130. This is higher than the previous technical calculation because the width of the new trading band is larger.
In the short term the oil price will hover around $98 to $100 with the potential to dip toward $94. A continued sideways drift in price will hit the upward trend line in late August. This creates the technical conditions for another rapid rally in prices. In the longer term the upward trend pressure in oil remains consistent. The move toward the first resistance target near $114 may be slower but the upward pressure remains strong. The expansion of the width of the trading band has increased the upside target following a successful breakout above resistance at $114.
Despite the short-term jubilation, the NYMEX oil chart shows continued bullish pressure. This will continue to contribute to inflation.
For traders this offers the opportunity to develop long positions as the price moves above $100. These traders use upside targets near $114. For oil buyers this suggests it is better to lock in forward prices at current levels rather than hold off taking hedging positions in anticipation of further sustained falls in the oil price below $100.
The author is a well-known international financial technical analysis expert.
?
| 分享按鈕 |