We have launched E-mail Alert service,subscribers can receive the latest catalogues free of charge

China’s Grain Supply and Development Trend during the 11th Five-Year Plan
2006-06-01


By Han Jun, Qin Zhongchun, Zhang Yunhua, Ding Xuedong, Zhang Yansong,
Wei Wei, Zhou Yanwei & Wang Yao
Research Report No 029, 2006
I. China’s Grain Supply Situation in the Short Term
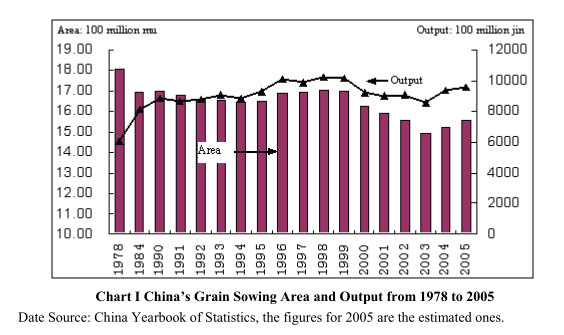
Since the initiation of the reform and opening-up, China’s grain output, reaching consecutively 350 billion kilograms, 400 billion kilograms, 450 billion kilograms and 500 billion kilograms, has made a historical change from a chronic shortage to a general balance, with surplus in years of bumper harvests, and has made important contributions to the sustainable and stable growth of the national economy. From 2000 to 2003, however, China registered a consecutive drop of its grain production, the annual grain output marked a big drop from the annual average during the 9th Five-Year Plan, and an annual supply shortage of more than 25 billion kilograms occurred. Although grain production was insufficient for four consecutive years, the total volume of grain market supply-demand basically maintained a balance. However, judging from the trend, it was approaching the turning point to short supply, and the grain security was at the verge of a grave situation. The grain supply issue existing from 1999 to 2003 was mainly reflected by "six drops or decreases" (i.e. drop in the grain growing acreage, drop in unit output, drop in total output, drop in the per-capita volume, drop by a large margin in the state’s grain storage and decrease in farmland area.) There were several main reasons causing these problems.
To cope with the grave situation in grain production occurred since 2004, under the leadership of the CPC Central Committee and the State Council, the governments at all levels have adopted more direct, effective and decisive support policies for grain production, effectively made use of the favorable weather conditions and seized the opportunity of grain price rise, and preliminarily reversed the grave situation of grain supply. In 2004, the total output of grain reached 469.45 billion kilograms. Although the total output was still short of 30 billion to 35 billion kilograms compared to the annual output of record high in history, it was an increase of 68 billion kilograms over the previous year, and marked the biggest annual increase in history, an increase of about 9%. In 2005, grain production maintained a growing trend. According to the preliminary statistics of the relevant departments, total output was expected to reach over 480 billion kilograms, an increase of 14.55 billion kilograms; the output per mu (one hectare equals 15 mu) was 309.5 kilograms, setting a new record; at the same time, the adjustment of grain structure was carried out steadily. After the increase of output for two consecutive years, the output of summer crops basically recovered to the 2000 level, thus effectively alleviating the supply-demand contradiction of wheat. At the same time, the output of early rice and autumn crops also increased steadily, the proportions of quality rice, quality corn and quality soy-bean also increased. The supply-demand contradiction of rice was alleviated, and the supply and demand of corn was able to strike a balance with slight surplus.
China's grain consumption could, according to the purpose of use, be classified into four main categories: grain for resident consumption, grain used as fodder, grain used as seeds and grain for industrial use,and they constitute the main parts of demand for grain. Excluding consumption, demand for grain also includes demand for export, the need for changes and adjustment of grain stock, waste and damage and spoilage. According to the nature of demand for grain consumption, grain consumption could also be divided into: general demand for grain, mainly consumption by ordinary consumers; demand for quality and special grain, mainly used for grain consumption by high-income residents and special processing demand of enterprises; consumption of commodity grain, that is, grain consumed in the circulation field, excluding grain produced and sold by the farmers; and grain used as fodder, that is, grain used for the development of animal husbandry and aquatic industries.
In the past decade or so, China’s grain consumption, at the time of a steady increase of the consumption base figure, also developed such features and trends as the inter-action between the quantity and quality of consumption, continuing evolution of consumption structure, continuing increase of the consumption level and the fast increase of consumption of commodity grain. They were mainly reflected by the following five aspects:
First, consumption by residents is drooping year by year, its proportion in the total demand is also dropping, and the consumption tends to stabilize amid its drooping trend. According to statistics from the National Bureau of Statistics, annual consumption of grain by urban residents on average dropped from 95 kilograms 10 years ago (1995) to about 79 kilograms, a per-capita drop of more than 15 kilograms; the annual consumption of grain by rural residents dropped from 258.9 kilograms to less than 230 kilograms, a per-capita drop of about 30 kilograms. The drop of grain consumption was not caused by a drop in the consumption level, but by the residents’ growing demand for more nutritious food such as meat, poultry, eggs and milk. At the same time, the consumption of edible vegetable oil increased by a large margin, and the residents are frequently eating out. According to statistics, in 2003, urban residents’ per-capita purchasing volume was 23.7 kilograms of meat, 9.8 kilograms of fish, 9.2 kilograms of poultry, 11.9 kilograms of eggs and 18.6 kilograms of fresh milk, increasing respectively by 12.6 kilograms, 1.8 kilograms, 4.8 kilograms, 3.6 kilograms and 13.9 kilograms over the figures for 1991; the per-capita volume of edible vegetable oil was 9.2 kilograms, an increase of 37.3% compared to the early 1990s. In 2003, grain consumption was about 20 kilograms when they ate out, an increase of about 5 kilograms compared to the 1990s.
Second, the consumption of grain used as fodder increased constantly, and its proportion in the total demand was also increasing. In 1990, the country’s volume of demand for grain used as fodder was 76 million tons, and it increased to 128 million tons in 2003, an increase of 69.17% or an annual growth of about five percentage points.
…
If you need the full text, please leave a message on the website.