China Core Cities & Metropolitan Area Development Index 2019 released


A key feature of the China Core Cities & Metropolitan Area Development Index is that it is an analysis of 36 core cities, including four municipalities, 22 provincial capitals, five capitals of autonomous regions, and five cities with independent planning status, against the evaluation of growth performance of 297 cities at prefecture level or above across the country. According to the analysis, the 36 core cities account for 40.5% of China's total GDP, 51.3% of the export of goods, 48.6% of the total number of authorized patents, 24% of the permanent resident population, 42% of the DID (Densely Inhabited Districts) population, 67.5% of the total number of listed companies on the main board, 94.8% of the prestigious universities under the Project 985 and Project 211, 57.8% of the five-star hotels, and 48.1% of the top hospitals.
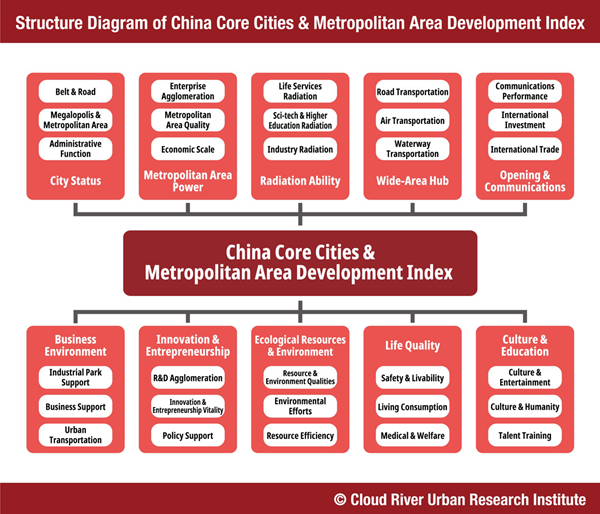
The China Core Cities & Metropolitan Area Development Index 2019 mainly measures 10 major items, namely the city status, metropolitan area power, radiation ability, wide-area hub, opening and communications, business environment, innovation and entrepreneurship, ecological resources and environment, life quality, as well as culture and education. It is also supported by 30 sub-items and 114 sets of index data to comprehensively evaluate the high-quality development of core cities in a science-based, systematic and detailed manner.
The China Core Cities & Metropolitan Area Development Index is supported by a selection of 438 data sets closely related with its theme, including statistical data, satellite remote sensing data and internet data, from the 878 data sets which support the China Integrated City Index. Therefore, the China Core Cities & Metropolitan Area Development Index is a Multimodal Index that uses the "five senses" to analyze and measure a city's development through statistical resources of different fields. For example, through satellite remote sensing data, we can analyse the relationship of population scale, distribution and density in DIDs with other factors like economic development, infrastructures, social development and ecological and environmental protection, elevating the research of metropolitan areas to a higher level.
It is worth noting that CO2 emissions data is included in the China Core Cities & Metropolitan Area Development Index 2019. Through years of efforts, Cloud River Urban Research Institute has finally been able to calculate CO2 emissions of each city through satellite data analysis and GIS analysis, which increased the accuracy and depth of its evaluations on the cities' performance.


- Countdown to 15th National Games: On-site warm-up entertains audience
- Eight missing after cargo ship collides with fishing vessel near Shandong
- Investing in people: a worthwhile investment
- Exhibition commemorating the epic relocation of universities opens in Fujian
- Twelve punished for scaffold collapse that killed 7 in Shandong
- Slovenian official visits whole-process people's democracy practice site of CPPCC committees