|
|

NPC & CPPCC Annual Sessions > Biz & Economy > Key Documents
|
Full text of China's 2008 statistical communiqué of economic, social developmentBy (Xinhua)
Updated: 2009-02-27 17:59 III. Industry and Construction In 2008, the total value added of the industrial sector was 12,911.2 billion yuan, up by 9.5 percent over the previous year. The value added of industrial enterprises above the designated size was up by 12.9 percent. Of this total, that of the state-owned and state-holding enterprises grew by 9.1 percent, that of the collective enterprises went up by 8.1 percent, that of the share-holding enterprises increased by 15.0 percent, that of the enterprises by foreign investors and investors from Hong Kong, Macao and Taiwan soared by 9.9 percent and 20.4 percent growth for private enterprises. Analyzed by light and heavy industries, the growth of the light industry was 12.3 percent and that of the heavy industry was 13.2 percent.
In 2008, of the industrial enterprises above designated size, the growth of value added for the mining and washing of coal industry was 19.1 percent over the previous year, for the extraction of petroleum and natural gas was 6.1 percent, for culture and education, sporting goods manufacturing industry 18.2 percent, for gas production and supply industry 26.8 percent, for processing of food from agricultural product 15.0 percent, for manufacture of general machinery 16.9 percent, for manufacture of transport equipment 15.2 percent, for manufacture of communication equipment, computers and other electronic equipment 12.0 percent and for manufacture of electrical machinery and equipment 18.1 percent, for chemical fiber manufacturing industry 2.2 percent. The growth of the value added for the major six high energy consuming industries were 10.0 percent, of which, that of the manufacture of non-metallic mineral products was 16.9 percent, smelting and pressing of ferrous metals 8.2 percent, manufacture of raw chemical materials and chemical products 10.0 percent, smelting and pressing of non-ferrous metals 12.3 percent, production and supply of electric power and heat power 8.6 percent and 4.3 percent for processing of petroleum, coking, processing of nuclear fuel. The value added growth for the high-tech industry was 14.0 percent over the previous year.
The profits made by the industrial enterprises above the designated size in the first 11 months of 2008 were 2,406.6 billion yuan, an increase of 4.9 percent over the same period of last year.
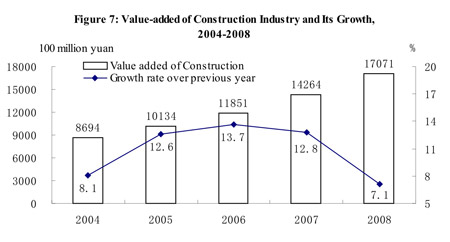
In 2008, the value added of construction enterprises in China was 1,707.1 billion yuan, up by 7.1 percent over the previous year. The profits made by construction enterprises qualified for general contracts and specialized contracts reached 175.6 billion yuan, up by 12.5 percent, of which the profits made by the state-owned and state-holding enterprises were 50.9 billion yuan, up by 21.8 percent. Their paid taxes were 205.8 billion yuan, up by 20.0 percent, of which the taxes paid by the state-owned and state-holding enterprises were 77.1 billion yuan, up by 24.7 percent.
|
       |
主站蜘蛛池模板: 治县。| 秀山| 合川市| 延安市| 博罗县| 始兴县| 沙坪坝区| 阜新| 平顺县| 含山县| 昌图县| 沽源县| 太康县| 德保县| 浙江省| 嘉禾县| 德保县| 慈溪市| 东海县| 眉山市| 东丽区| 安庆市| 贵德县| 湖州市| 中超| 蓬安县| 武清区| 安化县| 贵定县| 宜川县| 三亚市| 花垣县| 根河市| 灌云县| 多伦县| 呼伦贝尔市| 剑河县| 五指山市| 洞口县| 新宁县| 安阳县| 汤阴县| 闻喜县| 衡南县| 日土县| 郎溪县| 宜春市| 韩城市| 环江| 井研县| 东阿县| 唐河县| 滁州市| 汉源县| 象山县| 屯留县| 泸溪县| 姜堰市| 中山市| 林周县| 哈密市| 昌图县| 沂源县| 登封市| 紫金县| 东乡族自治县| 寿阳县| 石景山区| 新龙县| 星座| 侯马市| 江阴市| 榆林市| 兰西县| 安仁县| 武汉市| 邢台县| 卢龙县| 石嘴山市| 富锦市| 常宁市| 逊克县|